Supervisor
This report contains the following pages:
Overview
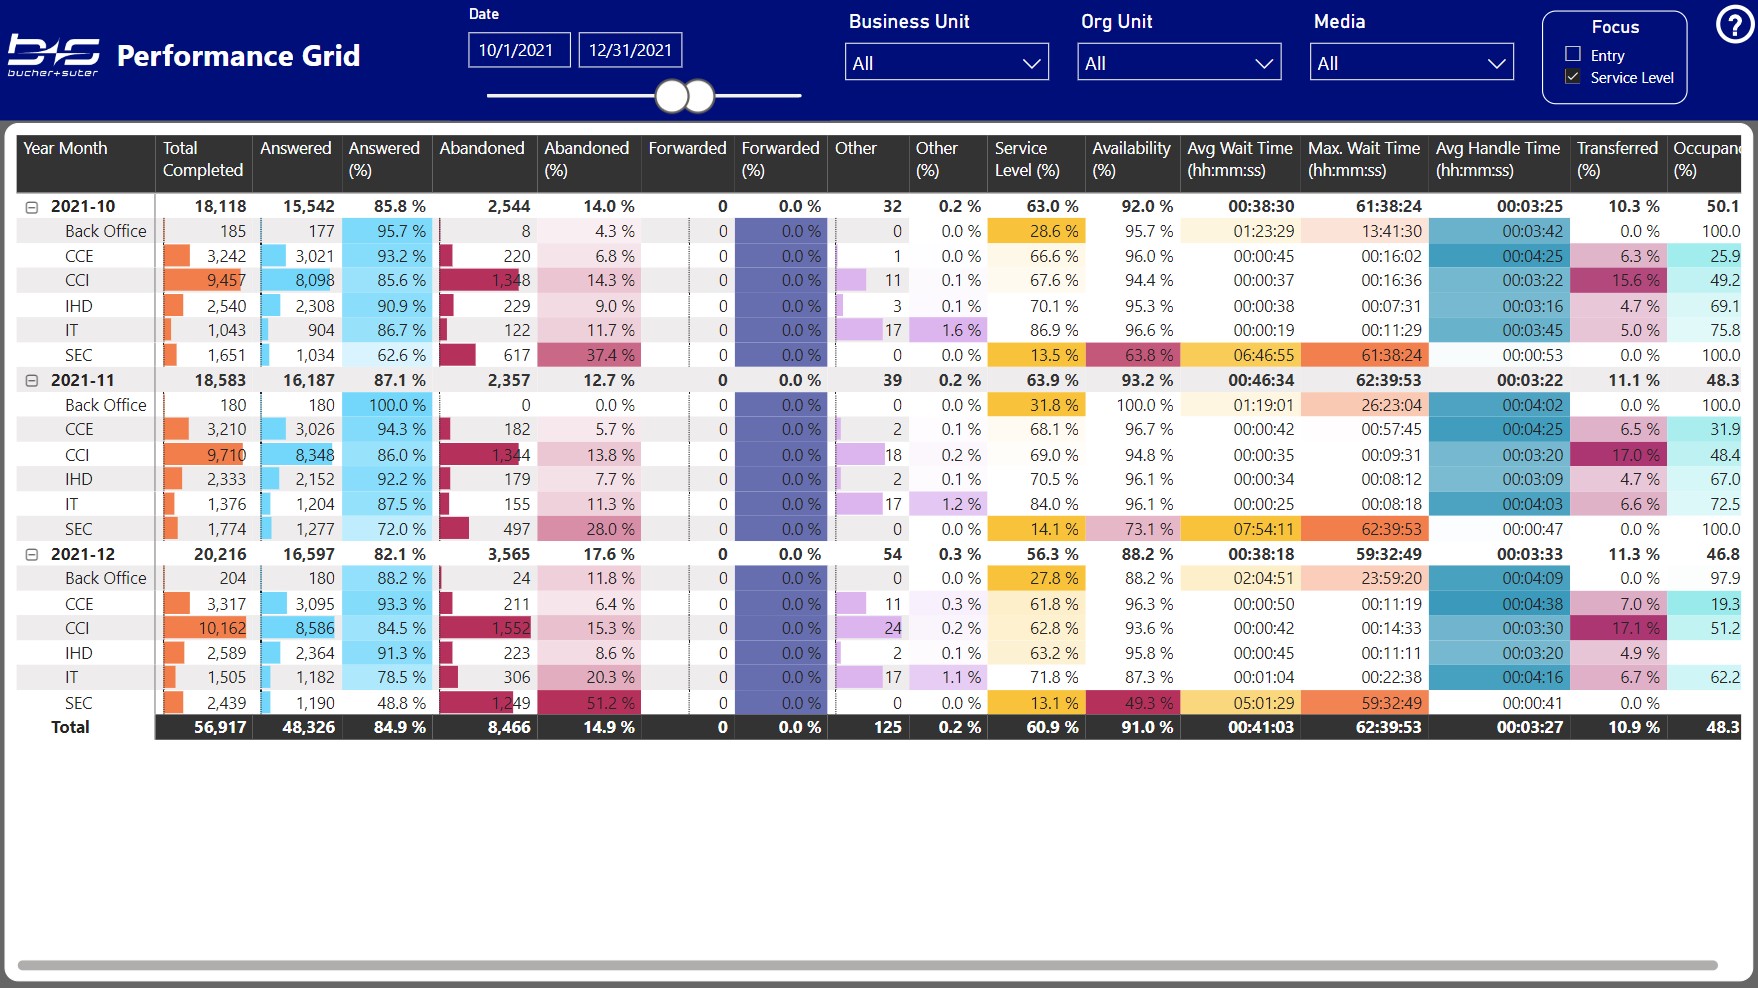
Performance Grid
Use this report to see the available measures in a tabular format including some groupings and conditional formatting.
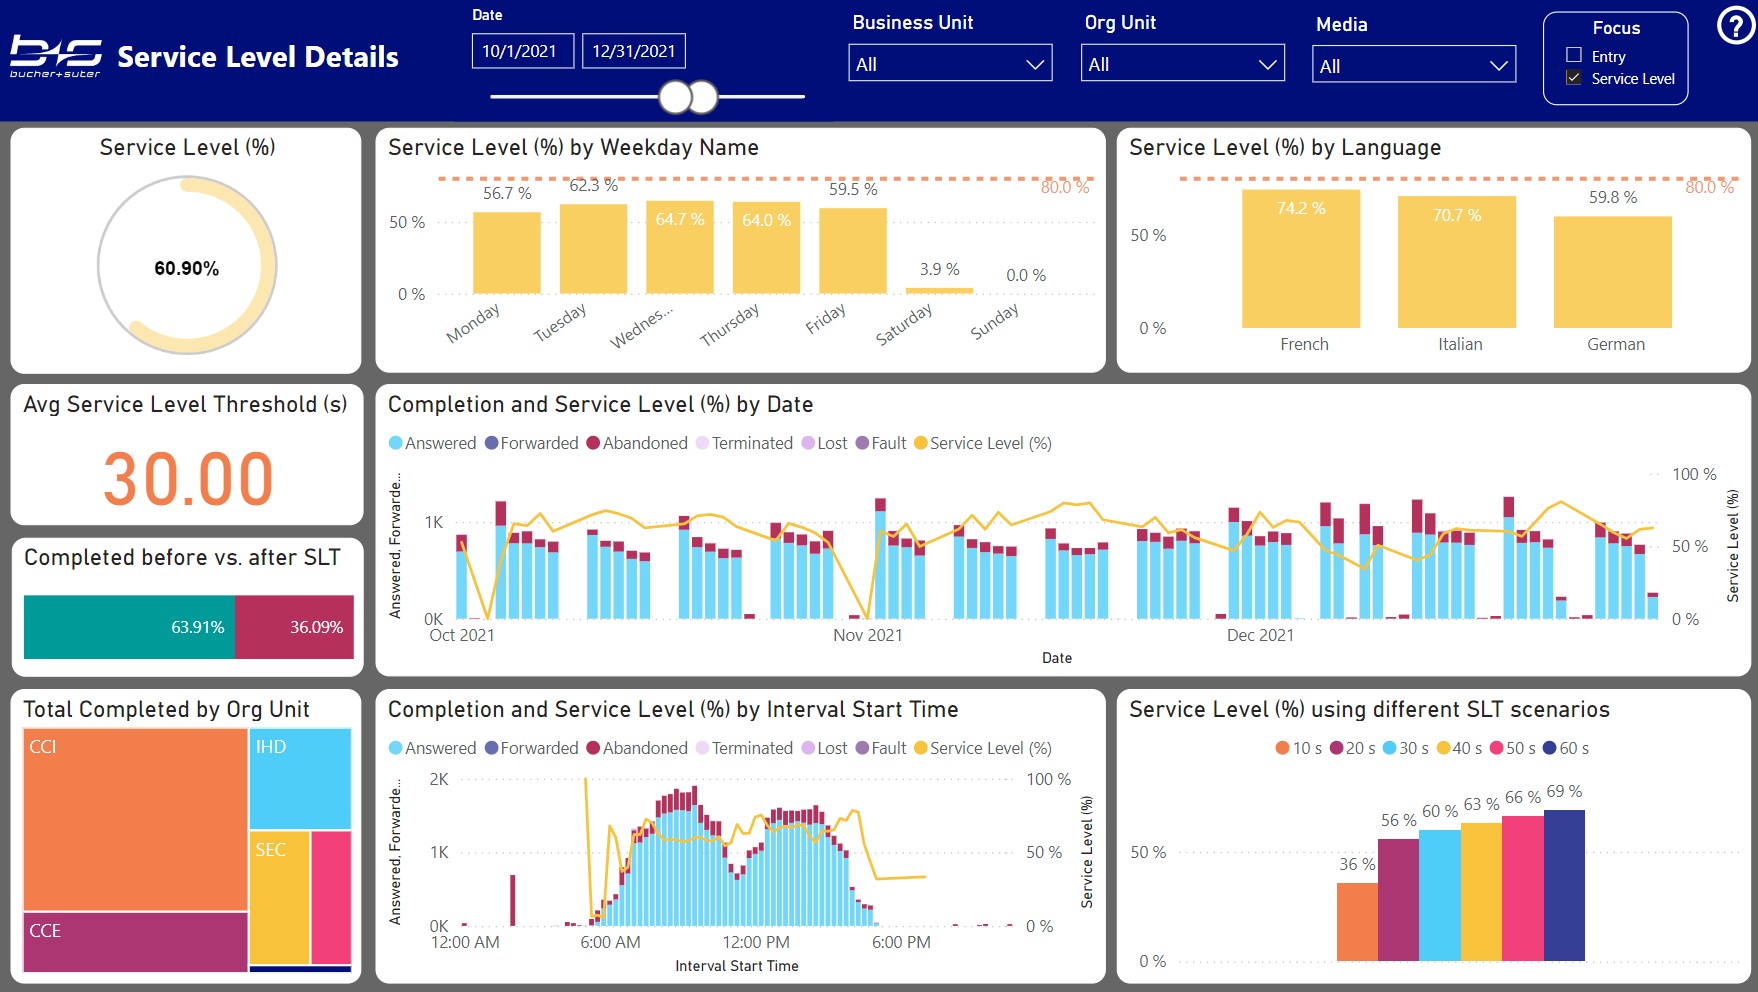
Service Level Details
This report helps you to investigate on the main drivers that affect your Service Level.
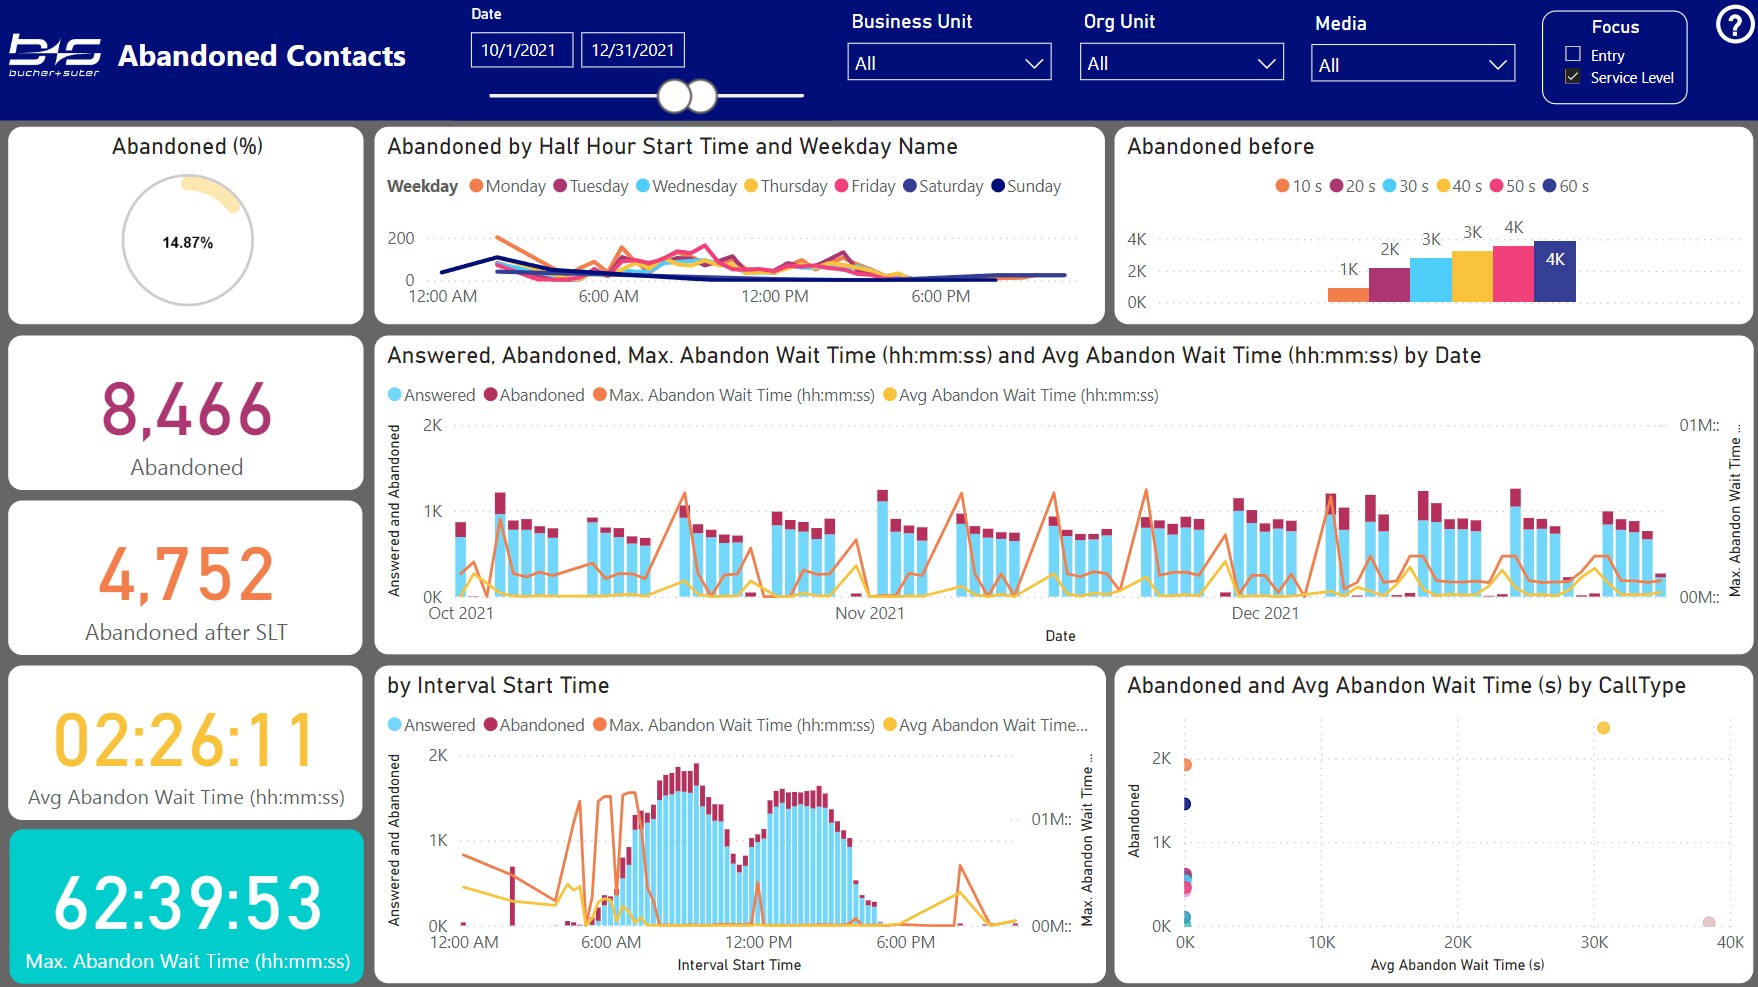
Abandonements
This report helps you to analyze your abandoned contacts and to find the reasons and areas where you could improve.
Agent States
Agent Overview
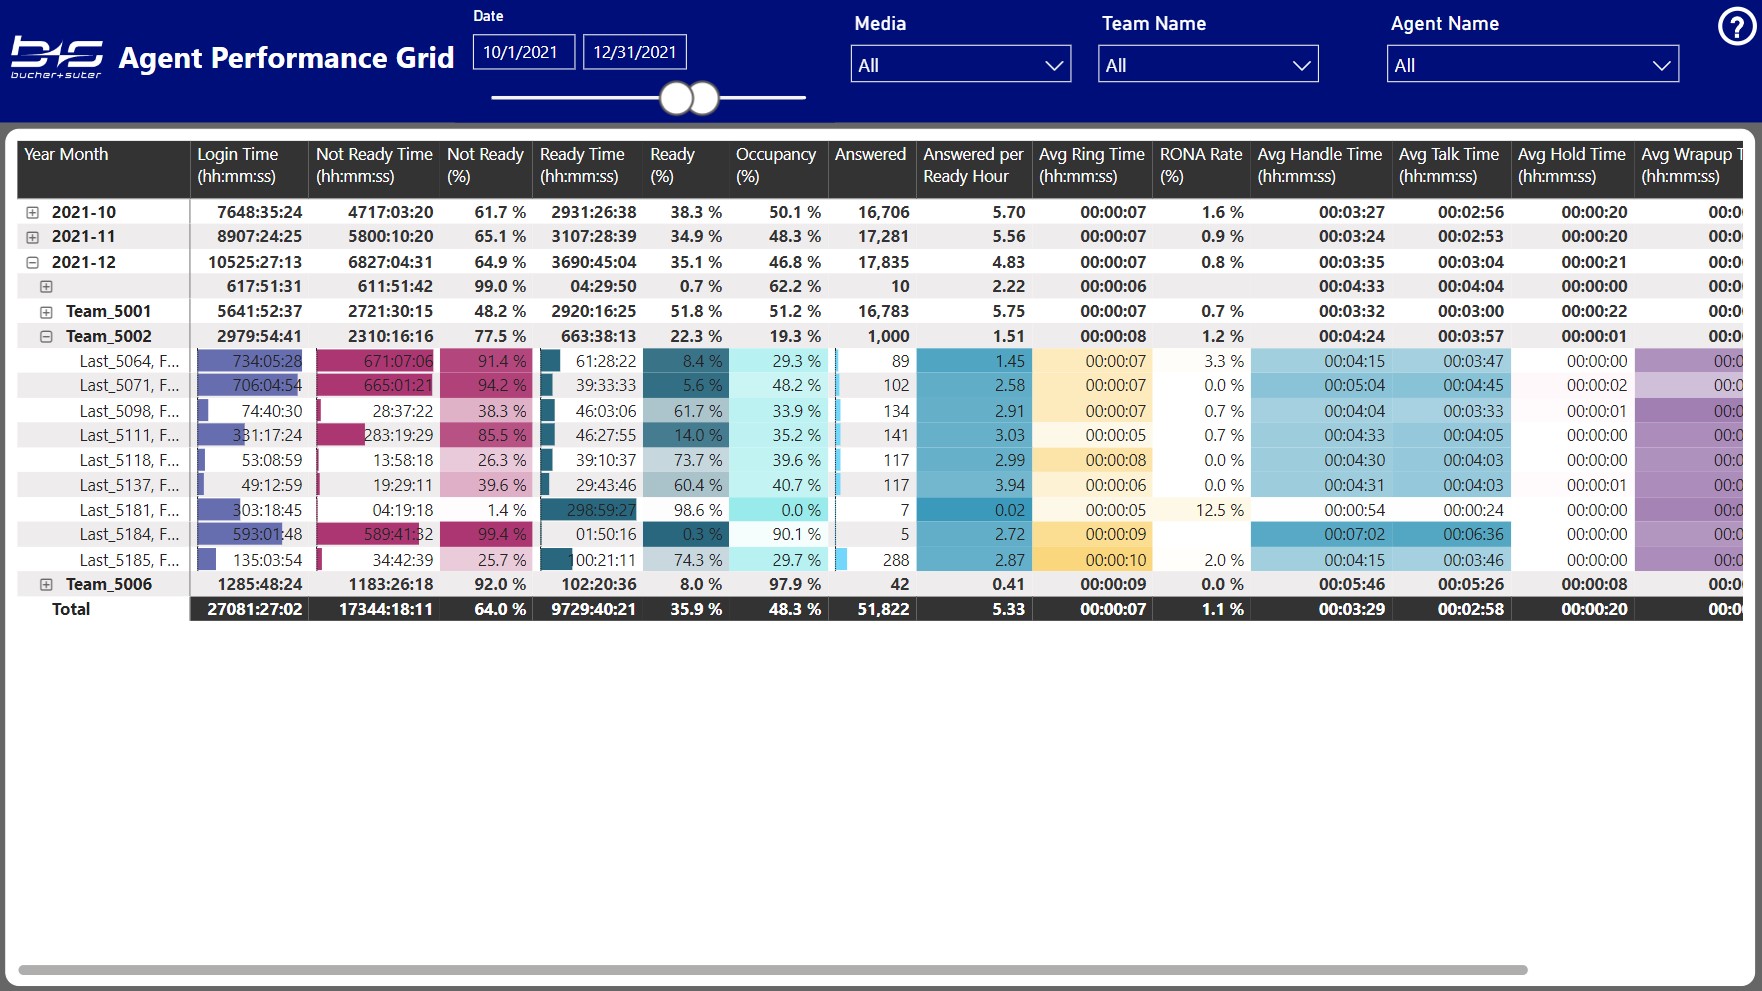
Agent Performance Grid
Use this report to see the available measures about your agents in a tabular format including some groupings and conditional formatting.
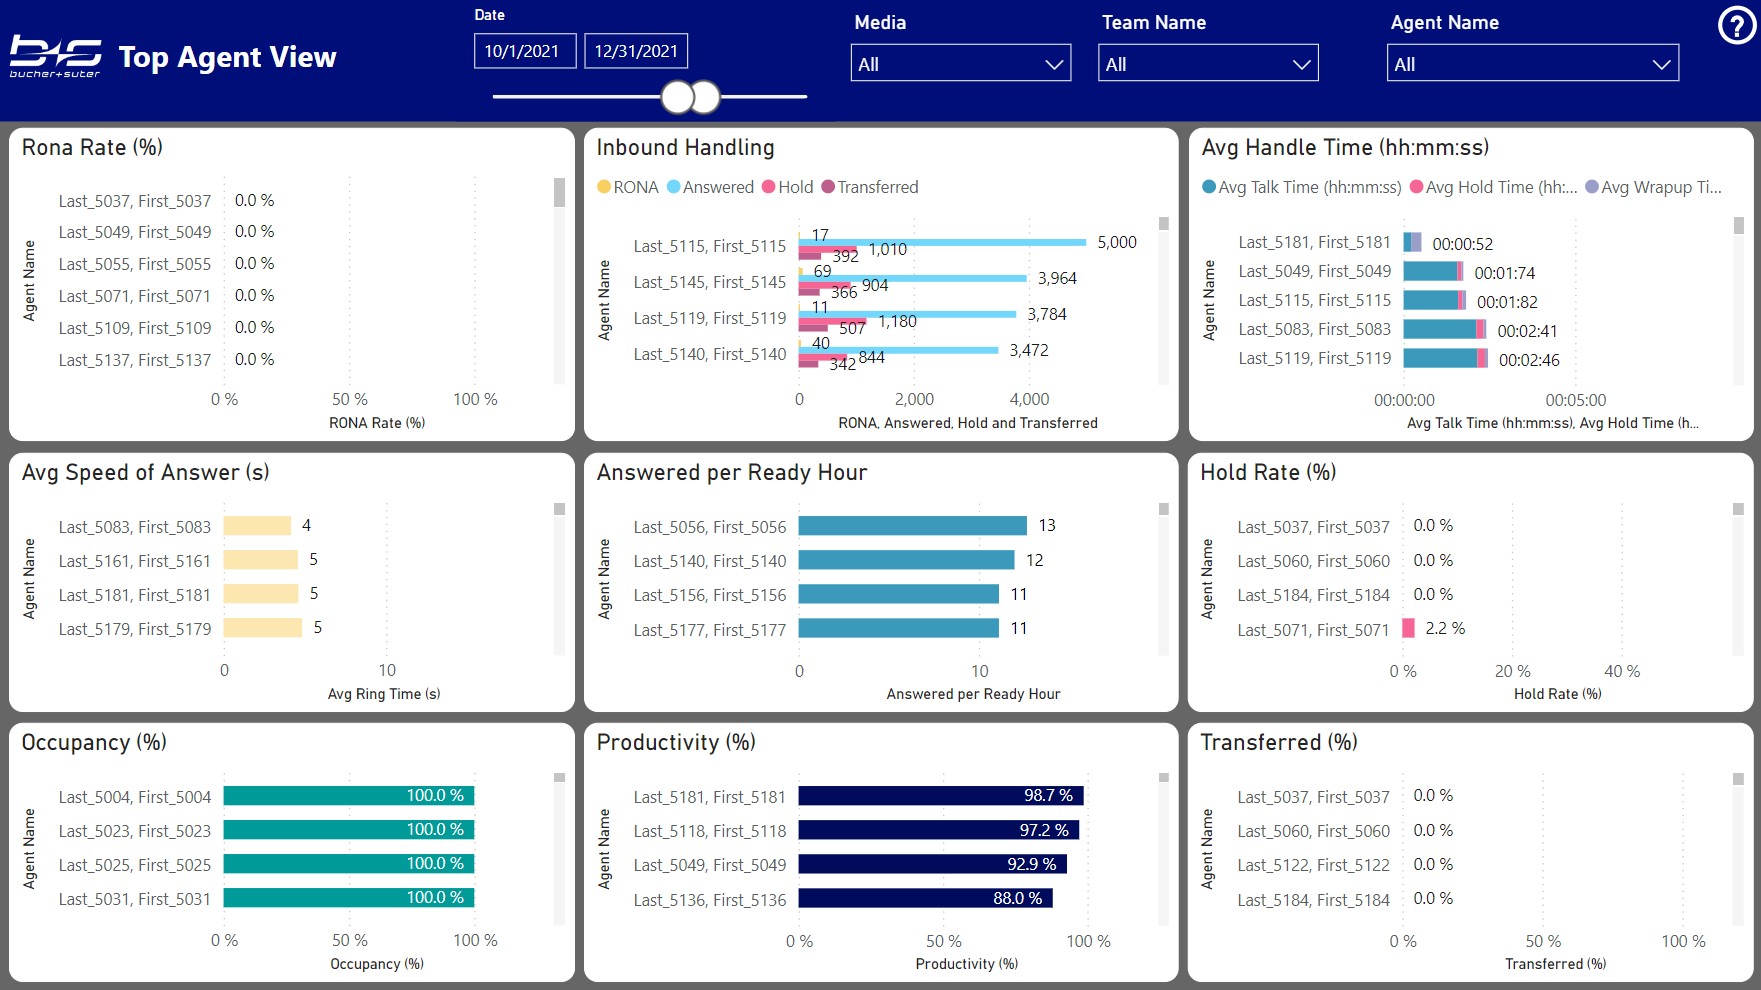
Top Agent View
This report displays the most important agent KPIs listed by agent names with the best agents on top.
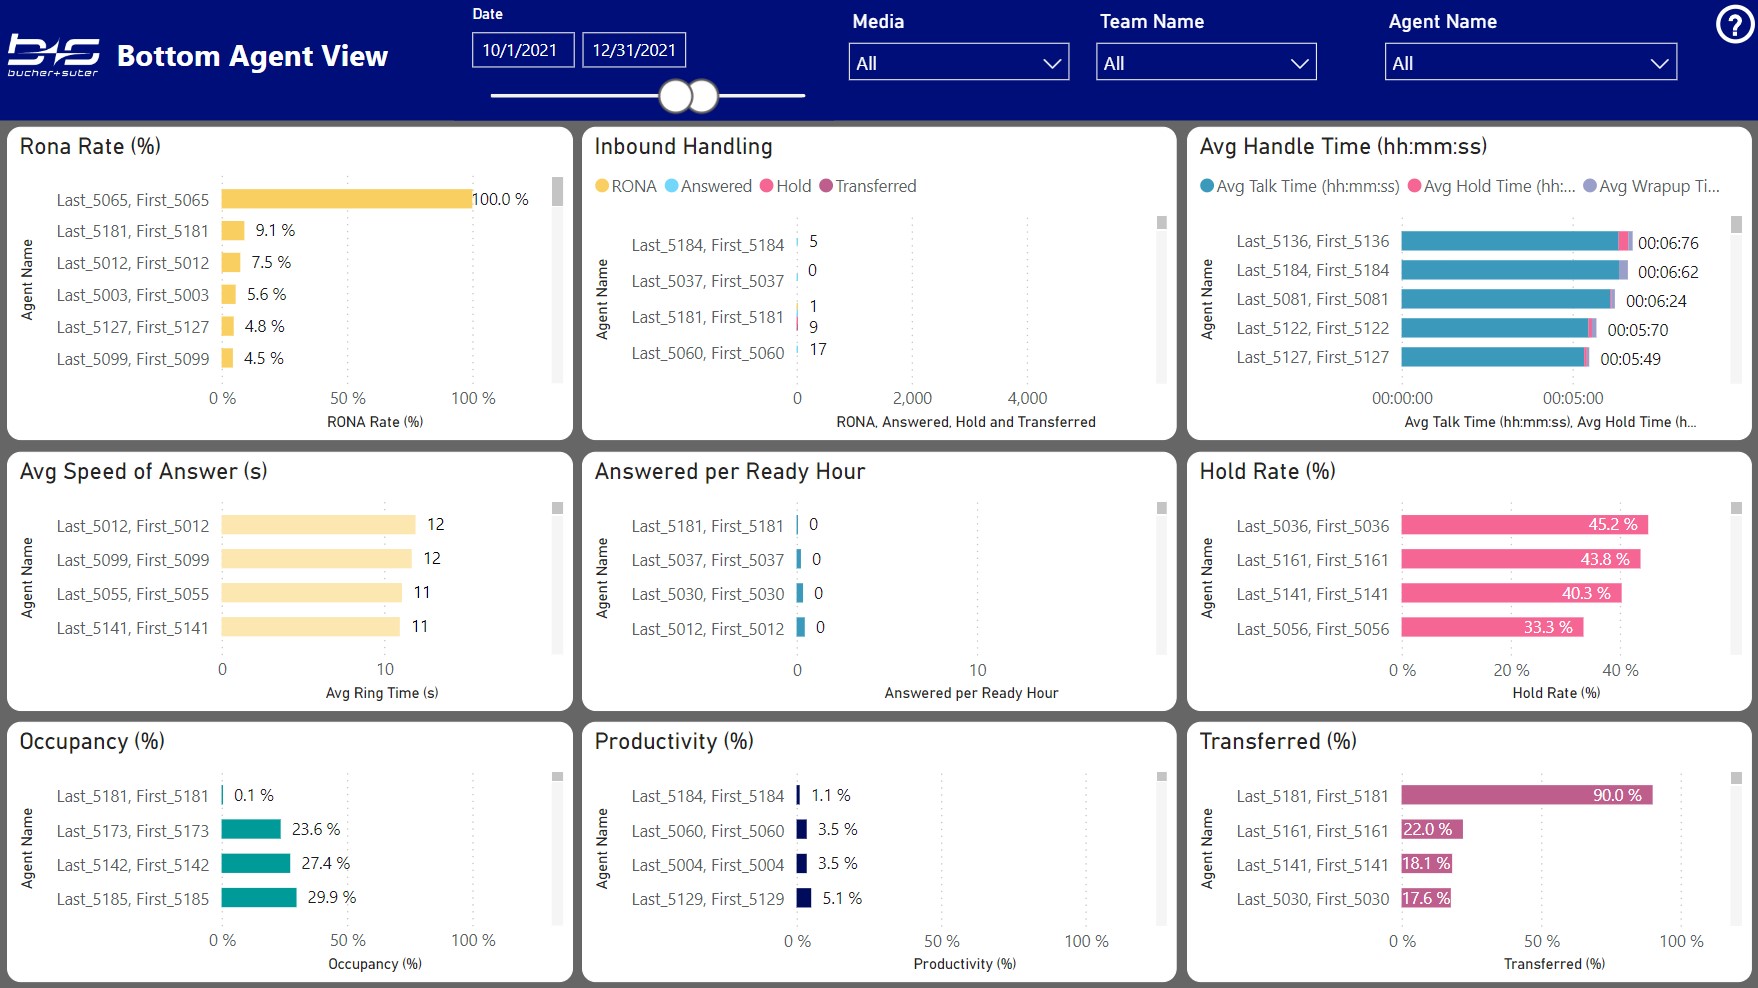
Bottom Agent View
This report displays the most important agent KPIs listed by agent names with the worst agents on top.
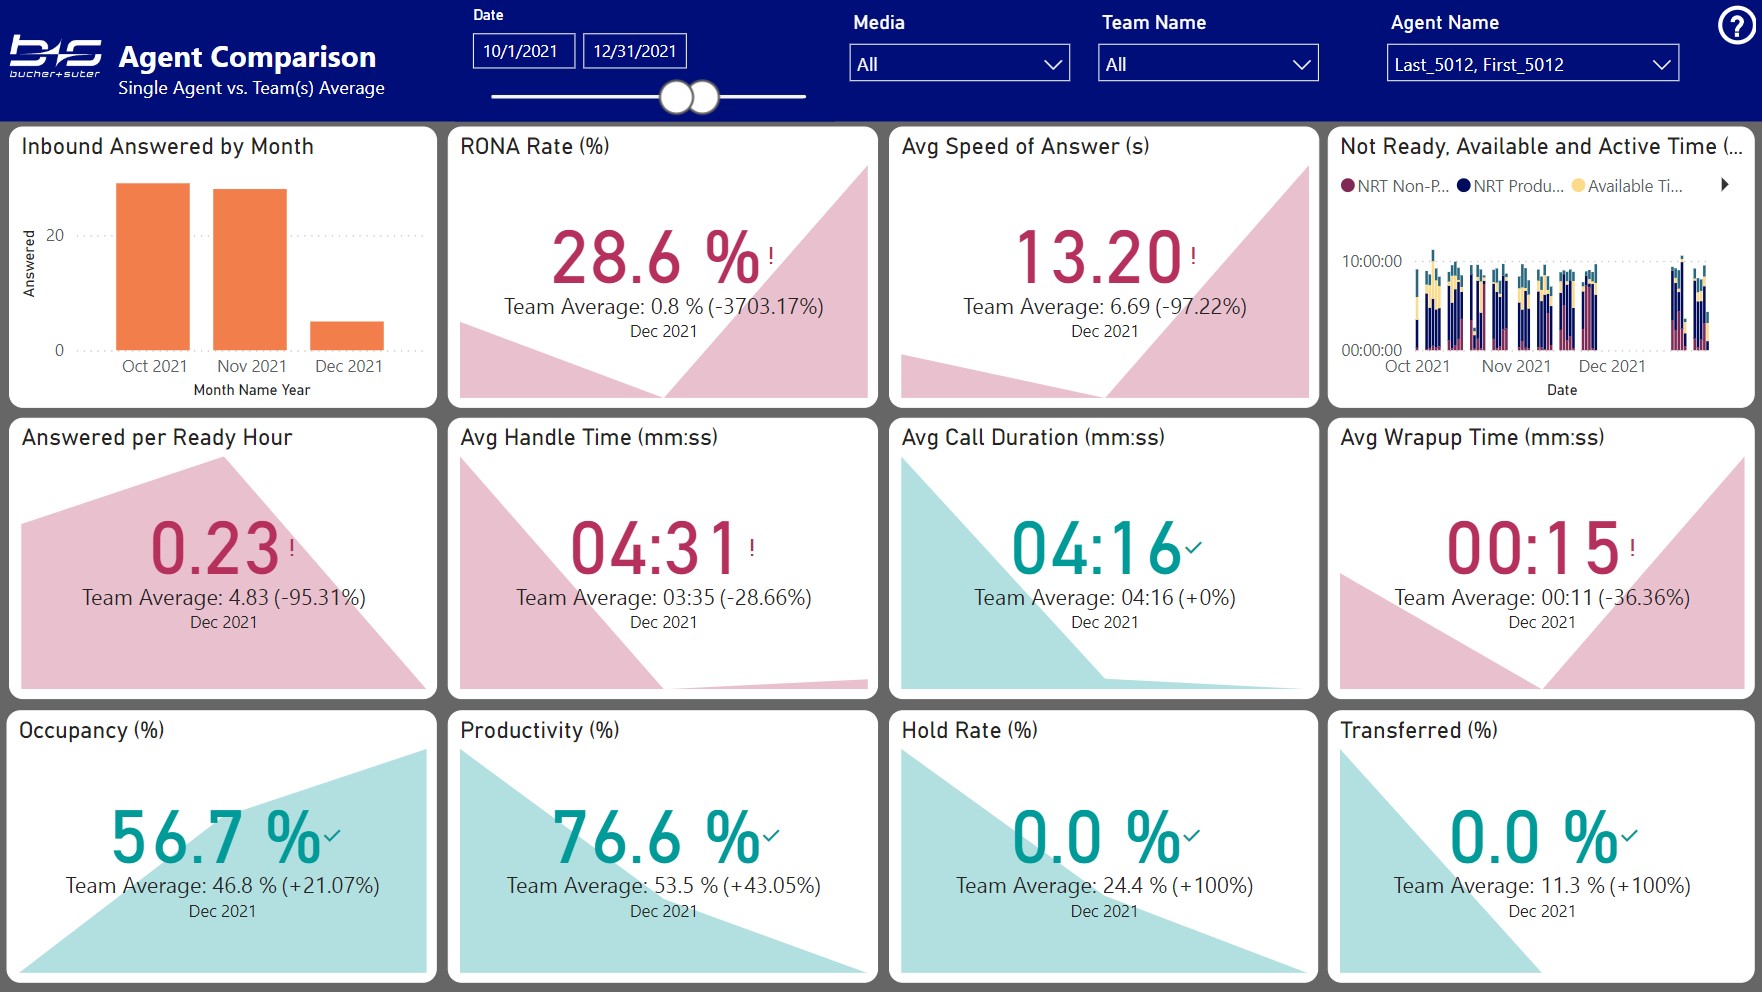
Agent Comparison KPI
This report allows you to compare a single agent with one or several selected teams. The KPI visuals contain the end value of the KPI for the agent and its course over time. The color indicates the value compared with the average value of the team(s) – green means better, red means worse than the team.
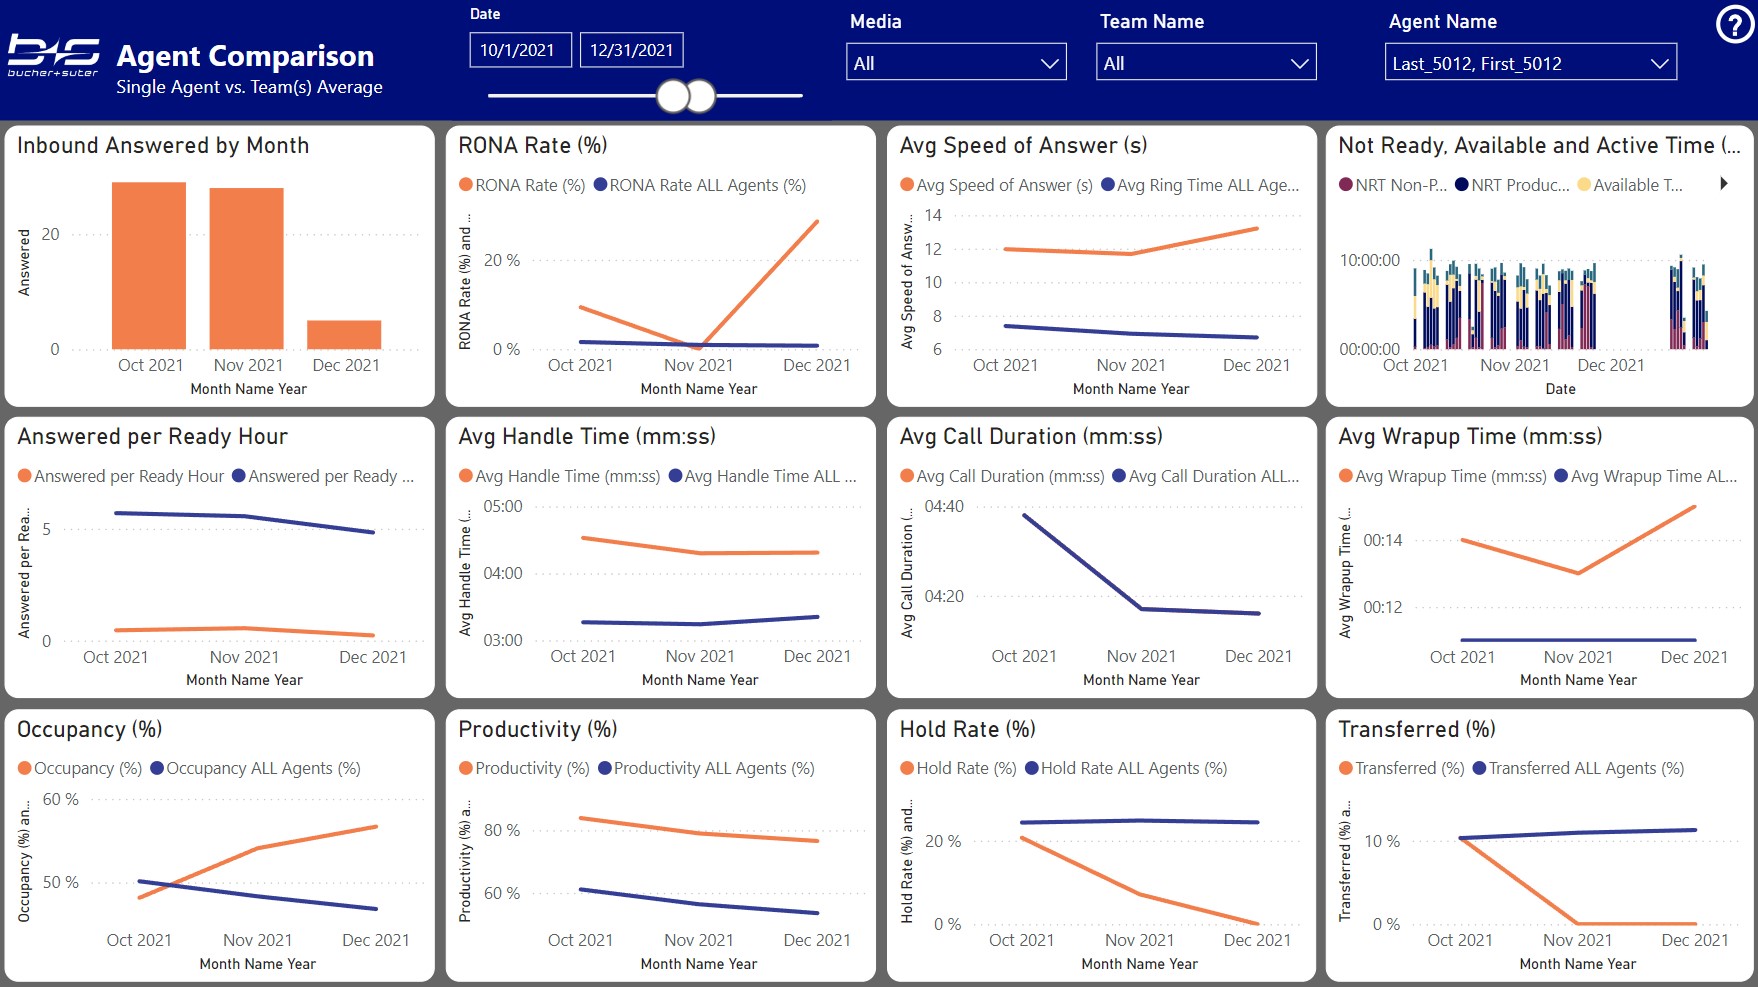
Agent Comparison Chart
This report allows you to compare a single agent with one or several selected teams. The line visuals contain the course of the KPI for the agent in orange and the team(s) in blue over time.